Answers
Real questions, each with a working example to open.
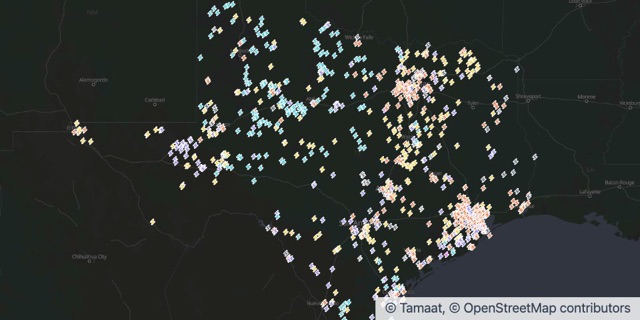 AnalysisHow do I add a chart that updates as I move the map?Add a widget from the Analytics menu and bind it to In view. It summarises the features you can see and recalculates as you pan, zoom or filter.
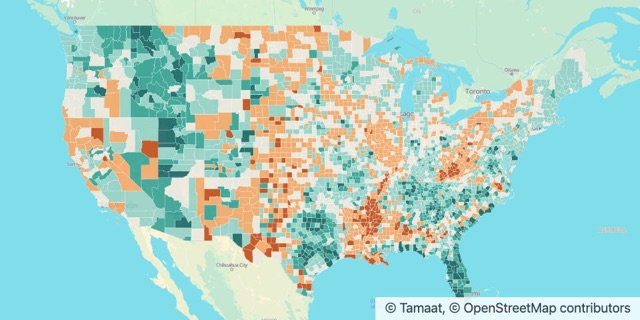 Maps and StylingHow do I colour areas by a number, like population change?Open Labels & Symbols, switch the symbol to Range and choose the numeric field. Tamaat splits the values into classes and colours each area by its class.
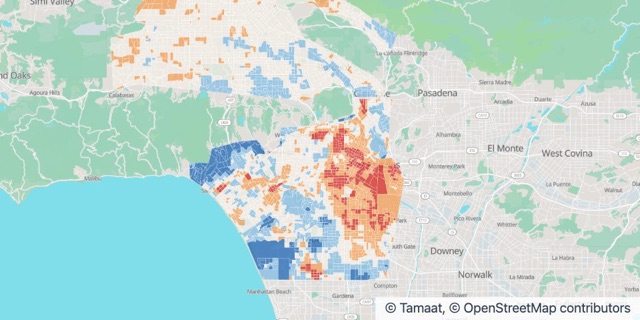 AnalysisHow do I show which areas run above or below the average?Colour each area by its difference from the average with a Range symbol, then add widgets that total what sits in the highest class. Pan or zoom and the numbers follow.
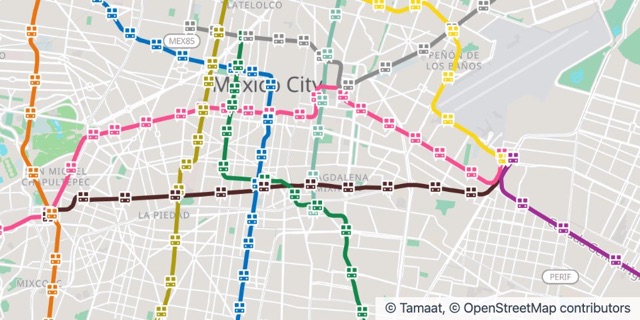 Maps and StylingHow do I draw a transit network in its own line colours?Style the lines by Category on the line name and give each line its agency colour. Stations go on a second layer, styled the same way.
 Maps and StylingHow do I publish a map as a web map?Choose Publish to Server from the map’s project menu, then share its website URL. Viewers get the map with its legend and data credit.
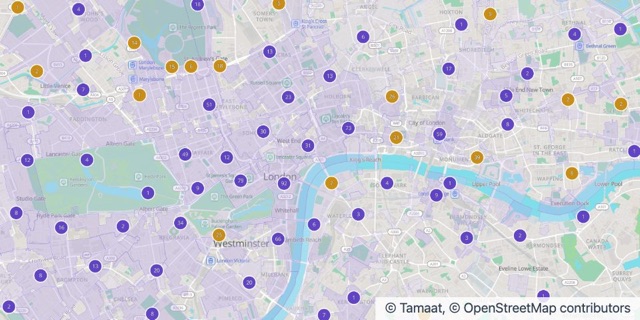
 Maps and StylingHow do I show tens of thousands of points without clutter?Switch on Clustering in the layer’s Symbol tab. Nearby points merge into counted bubbles as you zoom out and split apart as you zoom in.
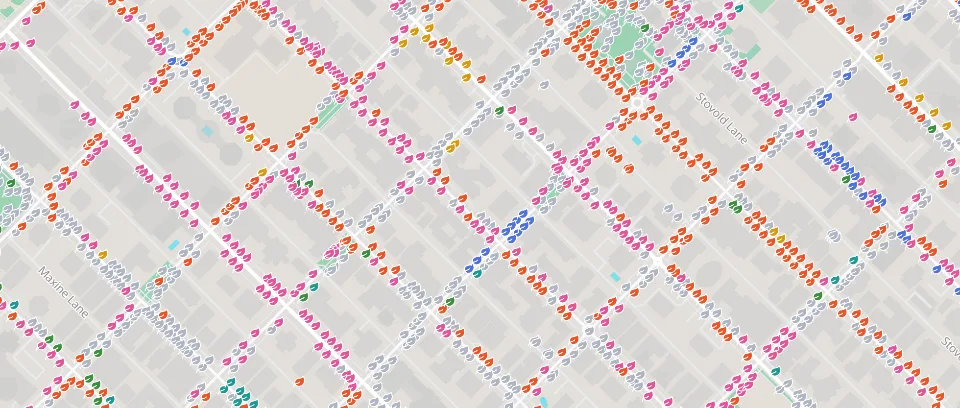
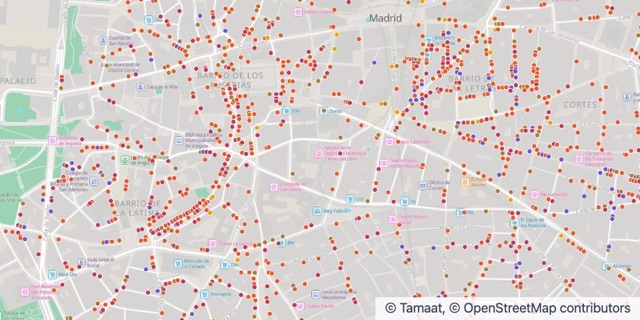 Maps and StylingHow do I colour points by category?Open Labels & Symbols on the layer, switch the symbol to Category and pick the field that holds the category. Each value gets its own colour, and the legend follows.
Can’t find it?
Ask the team. Good questions become answers here, with your permission.