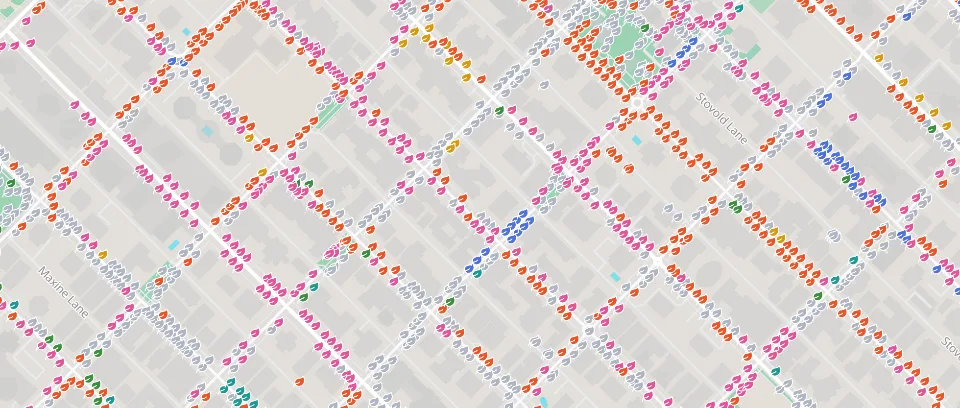
Vancouver street trees
Street trees in central Vancouver, coloured by species. Source: City of Vancouver Open Data, Open Government Licence – Vancouver.
Source: City of Vancouver Open Data, Open Government Licence – Vancouver.
Show every collision that hurt a pedestrian, cyclist or motorcyclist over three years. The dangerous streets become plain to see.
Vulnerable road user injuries, 2019–2021
Collisions, trees, services: one map that anyone can explore.
Crews add and update records on their phones, even offline. It all lands on the same map.
Share a public map people can open, explore and trust, with its sources in view.
Street trees in central Vancouver, coloured by species. Source: City of Vancouver Open Data, Open Government Licence – Vancouver.
Source: City of Vancouver Open Data, Open Government Licence – Vancouver.
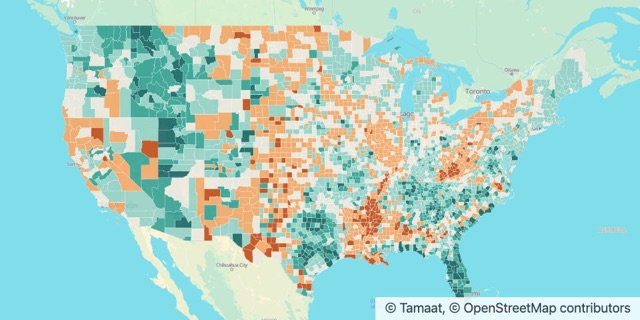
Population change by county, 2020 to 2024. Source: U.S. Census Bureau, Vintage 2024 Population Estimates and 2023 Cartographic Boundary Files, public domain.
Source: U.S. Census Bureau, Vintage 2024 Population Estimates; 2023 Cartographic Boundary Files. Public domain.
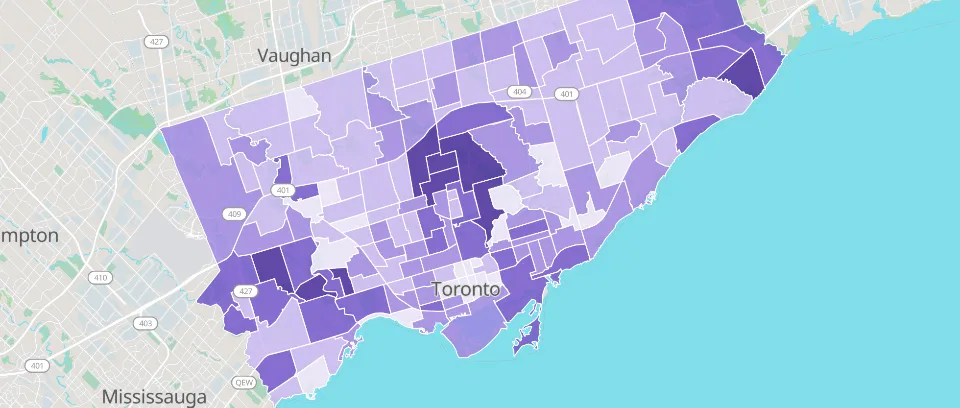
Median household income in Toronto’s 158 neighbourhoods, from the 2021 Census. Sources: City of Toronto Open Data, Open Government Licence – Toronto; Statistics Canada, Statistics Canada Open Licence.
Sources: City of Toronto Open Data, Open Government Licence – Toronto; Statistics Canada, Statistics Canada Open Licence.
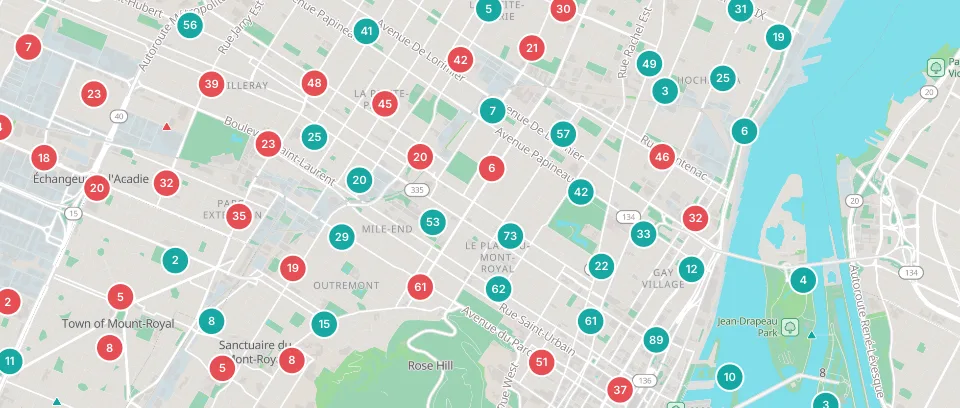
Collisions that injured a pedestrian, cyclist or motorcyclist in Montréal, 2019 to 2021. Source: Ville de Montréal Open Data, CC BY 4.0.
Source: Ville de Montréal Open Data, Creative Commons Attribution 4.0 International (CC BY 4.0).
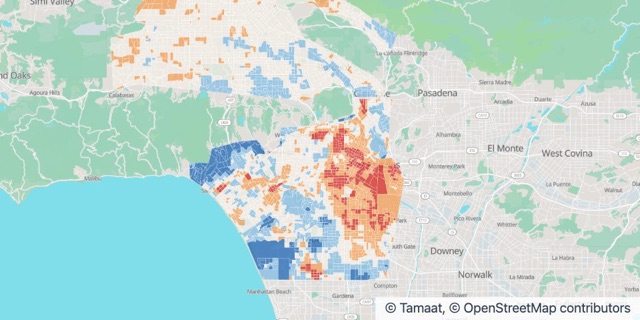
Afternoon air temperature by census block group, compared with the area average. Source: NOAA and CAPA Strategies, Urban Heat Island Mapping Campaign (heat.gov), CC0; U.S. Census Bureau.
Source: NOAA and CAPA Strategies, Urban Heat Island Mapping Campaign (heat.gov), CC0; U.S. Census Bureau.
Open an example in your workspace, or let us show you Tamaat on your own data.