Learn
Guides, answers and plain-language terms. Each one ends with something you can open and try.
Featured
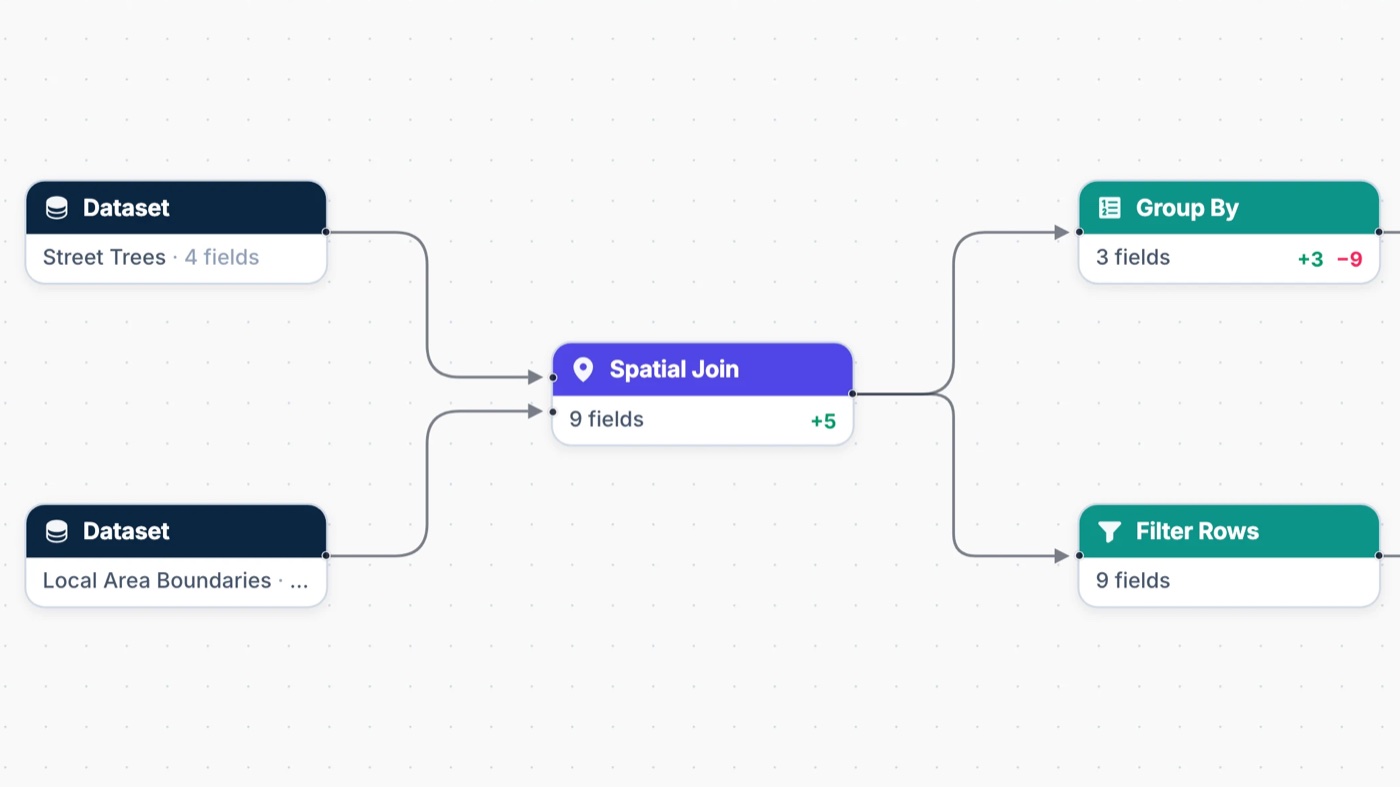 Guide · 10 minutesExample: File to Delivered OutputBuild a complete flow from a CSV in Files to a delivered GeoJSON, then release it for a scheduled refresh.
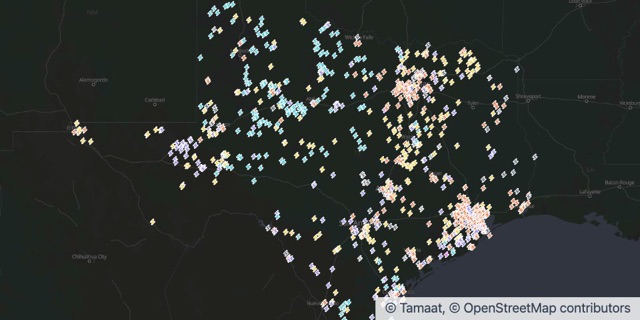 AnswerHow do I add a chart that updates as I move the map?Add a widget from the Analytics menu and bind it to In view. It summarises the features you can see and recalculates as you pan, zoom or filter.
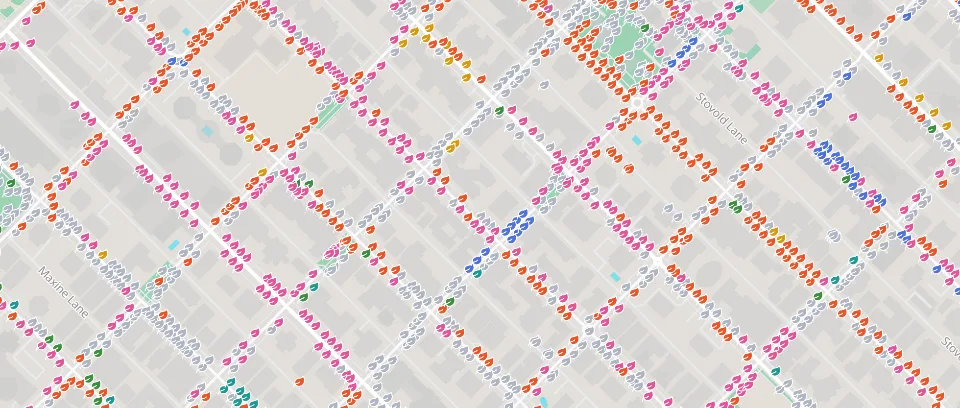 GalleryWorking maps you can open and make your own.
Browse by Topic
- Maps and Styling9
- Data and Connections1
- Flows and ETL1
- Analysis4
- Dashboards1
- APIs1
- Field App1
- Tamaat AI1
- Monitors1
Guides
All Guides →Recent Answers
All Answers →- How do I add a chart that updates as I move the map?Map project
- How do I colour areas by a number, like population change?Map project
- How do I show which areas run above or below the average?Map project
- How do I draw a transit network in its own line colours?Map project
- How do I publish a map as a web map?Map project
Can’t find it?
Ask the team. Good questions become answers here, with your permission.