Make the heat visible.

See which blocks run hotter than their neighbours on a summer afternoon, and how many people live in them.

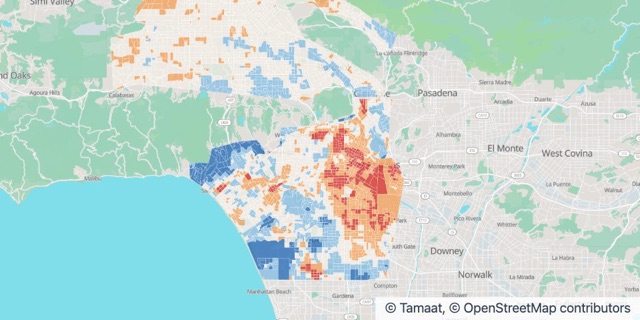
Los Angeles urban heat

Afternoon heat vs area average

  • 3 °F or more cooler
  • 1 – 3 °F cooler
  • Near average
  • 1 – 3 °F hotter
  • 3 °F or more hotter

What environment teams do with Tamaat

  • See who runs hot and who runs cool

    See at a glance which places run above the average and which run below.

  • See the hazards together

    Heat, fire and flood on one map, side by side.

  • Watch places change

    Keep an eye on an area and review what changed, right beside your maps.

Stories From the Gallery

Los Angeles urban heat

Los Angeles urban heat

Afternoon air temperature by census block group, compared with the area average. Source: NOAA and CAPA Strategies, Urban Heat Island Mapping Campaign (heat.gov), CC0; U.S. Census Bureau.

Source: NOAA and CAPA Strategies, Urban Heat Island Mapping Campaign (heat.gov), CC0; U.S. Census Bureau.

California fire history
Also in Insurance and Risk

California fire history

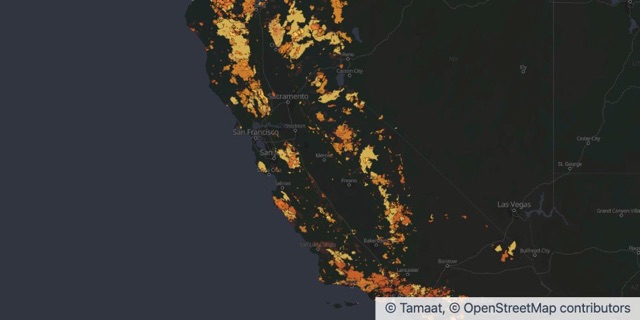
Fire perimeters of 1,000 acres or more, 1950 to 2025, by decade. Source: CAL FIRE FRAP and partner agencies, California Fire Perimeters, CC BY.

Source: CAL FIRE FRAP and partner agencies, California Fire Perimeters, CC BY.

New York cloudburst flooding
Also in Insurance and Risk

New York cloudburst flooding

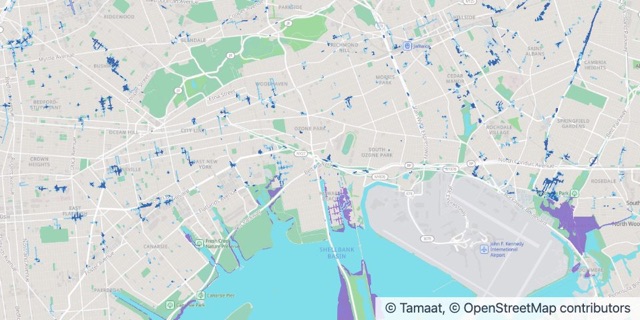
Flooding in a moderate cloudburst (2.13 in/hr) with 2050 sea level rise. Source: NYC Department of Environmental Protection, NYC Stormwater Flood Maps, NYC Open Data.

Source: NYC Department of Environmental Protection, NYC Stormwater Flood Maps (moderate flood with 2050 sea level rise), NYC Open Data.

Guides and Answers

Start from a working map.

Open an example in your workspace, or let us show you Tamaat on your own data.