California fire history
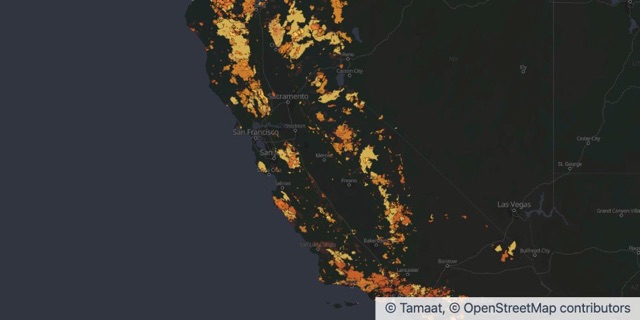
Fire perimeters of 1,000 acres or more, 1950 to 2025, by decade. Source: CAL FIRE FRAP and partner agencies, California Fire Perimeters, CC BY.
Source: CAL FIRE FRAP and partner agencies, California Fire Perimeters, CC BY.
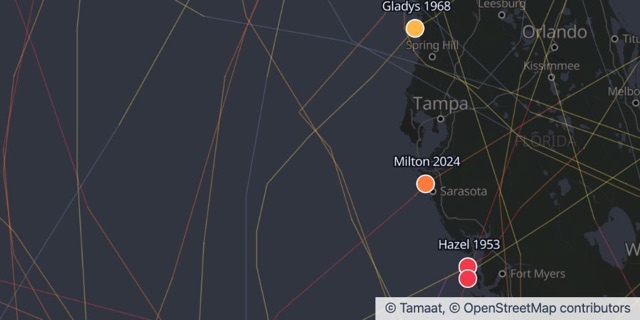
Put decades of hurricanes on the coast you cover. Zoom in on your stretch of shoreline and see how many made landfall, how strong they were, and when.
Storm tracks
Drop your portfolio on the map and see what storms, fires and floods have done around it.
Ask which of your locations sit in harm’s way. Get a map and a list back.
Underwriting, claims and leadership all look at the same live map.
Fire perimeters of 1,000 acres or more, 1950 to 2025, by decade. Source: CAL FIRE FRAP and partner agencies, California Fire Perimeters, CC BY.
Source: CAL FIRE FRAP and partner agencies, California Fire Perimeters, CC BY.
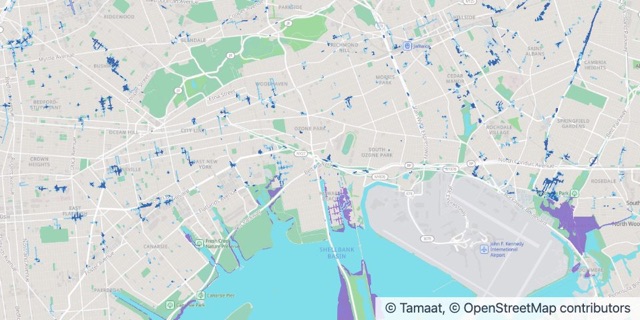
Flooding in a moderate cloudburst (2.13 in/hr) with 2050 sea level rise. Source: NYC Department of Environmental Protection, NYC Stormwater Flood Maps, NYC Open Data.
Source: NYC Department of Environmental Protection, NYC Stormwater Flood Maps (moderate flood with 2050 sea level rise), NYC Open Data.
Hurricane landfalls in Florida since 1950, with their tracks. Source: NOAA National Hurricane Center, HURDAT2 Atlantic best track, public domain.
Source: NOAA National Hurricane Center, HURDAT2 Atlantic best track, public domain.
Open an example in your workspace, or let us show you Tamaat on your own data.