Paris home prices
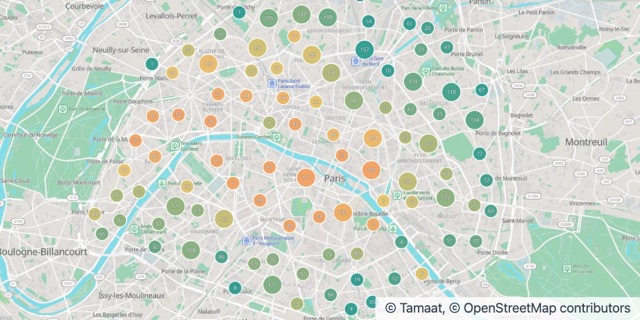
Sales of a single apartment in Paris, October to December 2025, by price per m². Source: DGFiP, Demandes de valeurs foncières (DVF), Licence Ouverte 2.0.
Source: DGFiP, Demandes de valeurs foncières (DVF), Licence Ouverte 2.0.
See every home sale on one map and watch prices change from one street to the next. Zoom in on a neighbourhood and the typical price follows.
Price per m², late 2025
Map recent sales and see where values climb and where they dip.
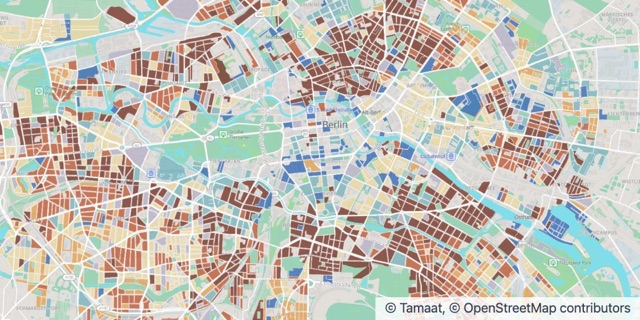
Zoning, building age and new development, all on the same streets.
Ask what’s near a site and get the map and the numbers back.
Sales of a single apartment in Paris, October to December 2025, by price per m². Source: DGFiP, Demandes de valeurs foncières (DVF), Licence Ouverte 2.0.
Source: DGFiP, Demandes de valeurs foncières (DVF), Licence Ouverte 2.0.
Construction period of residential blocks inside the S-Bahn ring. Source: Senatsverwaltung für Stadtentwicklung Berlin, Umweltatlas, Gebäudealter (2015), dl-de/zero-2.0.
Source: Senatsverwaltung für Stadtentwicklung Berlin, Umweltatlas, Gebäudealter (2015), dl-de/zero-2.0.
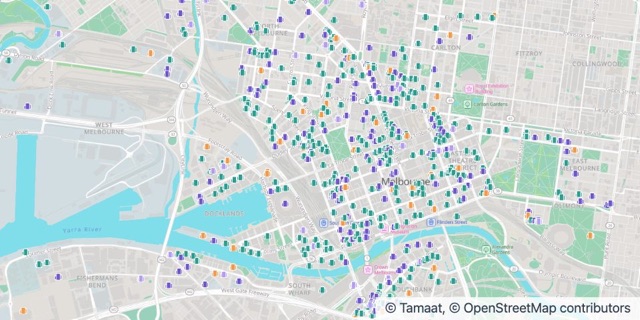
Development projects completed since 2016 and in the pipeline. Source: City of Melbourne, Development Activity Monitor, CC BY 4.0.
Source: City of Melbourne, Development Activity Monitor, CC BY 4.0.
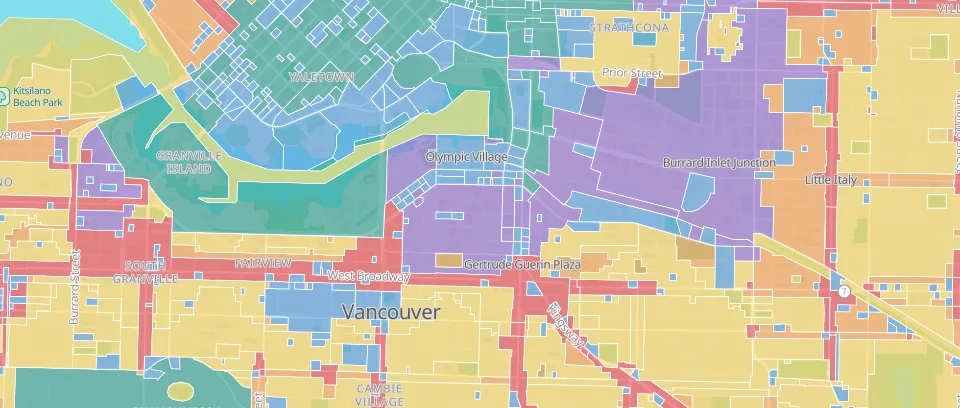
Vancouver’s zoning districts in six land uses. Source: City of Vancouver Open Data, Open Government Licence – Vancouver.
Source: City of Vancouver Open Data, Open Government Licence – Vancouver.
Open an example in your workspace, or let us show you Tamaat on your own data.