Gallery
Real maps, built on real data. Open any one in your workspace and make it your own.
17 results
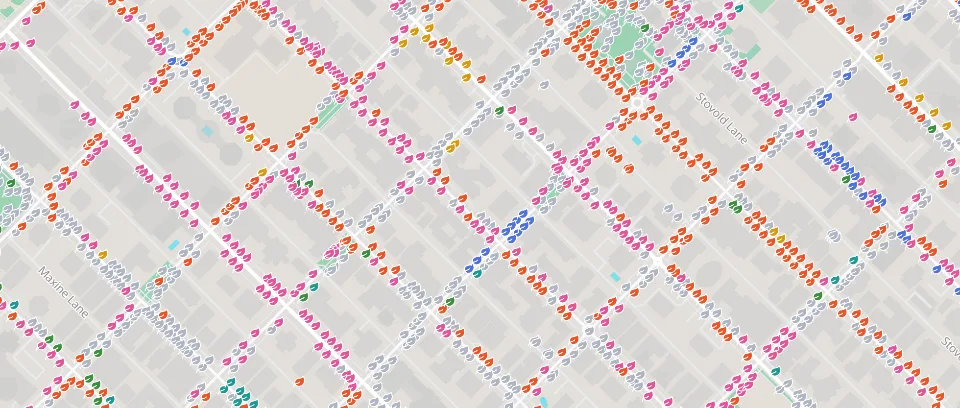 MapVancouver street trees34,000 city trees by species. Clusters show the mix at a glance; click a tree for its size, height and address.Cities and Public SectorCity of Vancouver
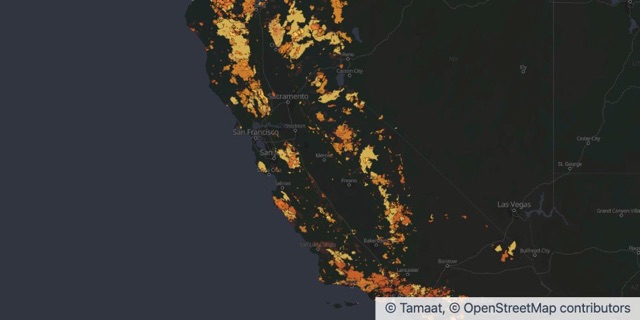 Map + ChartsCalifornia fire historyEvery fire of 1,000 acres or more since 1950. Drag across the years and watch the recent megafires light up.Insurance and RiskCAL FIRE FRAP
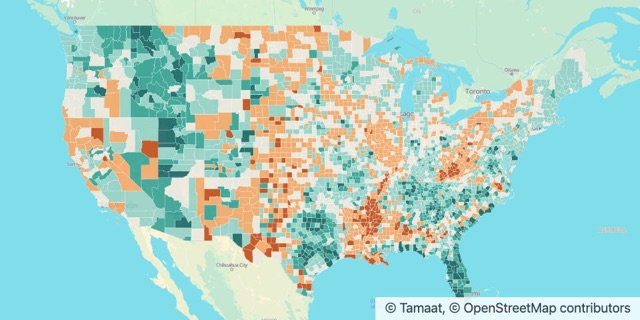 Map + ChartsWhere America is growingPopulation change in every U.S. county from 2020 to 2024. Texas and Florida added nearly four million people.Cities and Public SectorU.S. Census Bureau
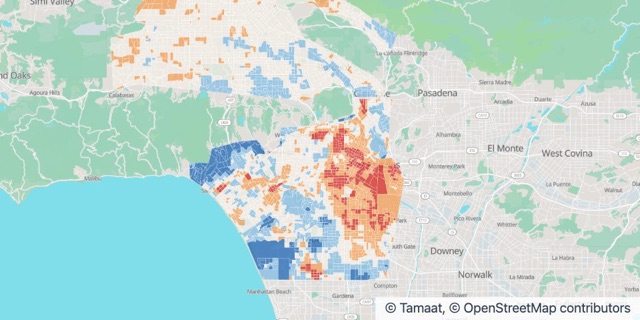 Map + ChartsLos Angeles urban heatBlock by block, where LA runs hotter than its neighbours on a summer afternoon. 442,000 people live in the hottest blocks.Environment and ClimateNOAA and CAPA Strategies
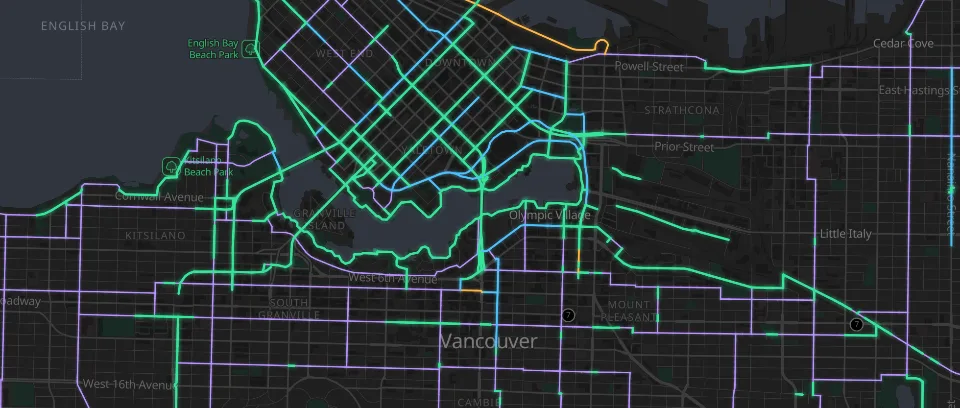 MapVancouver bikewaysThe whole cycling network by lane type. See where protected lanes stop and plan the next link.Transportation and LogisticsCity of Vancouver
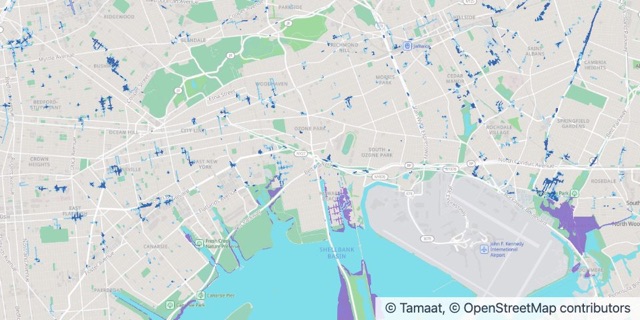 Map + ChartsNew York cloudburst floodingWhich streets go under water in a heavy cloudburst, and where the 2050 high tides reach. Check a block before you buy, build or insure.Insurance and RiskNYC Department of Environmental Protection
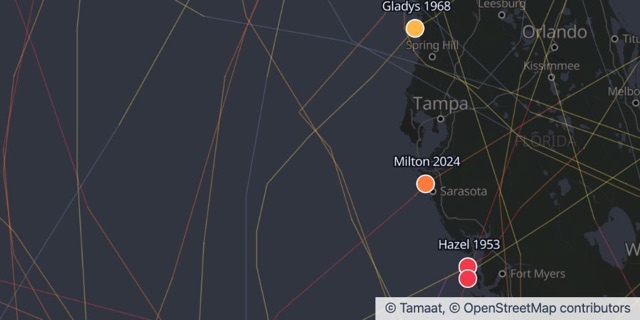 Map + ChartsFlorida hurricane landfallsThe 38 hurricanes that came ashore in Florida since 1950, each one named. Andrew, Michael, Ian, Milton.Insurance and RiskNOAA National Hurricane Center
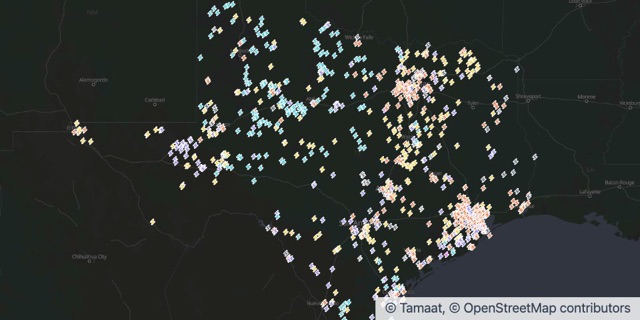 Map + ChartsWhat powers TexasEvery power plant in Texas by its main fuel. Gas around the cities, wind out west, and solar and batteries arriving fast.Energy and UtilitiesU.S. Energy Information Administration
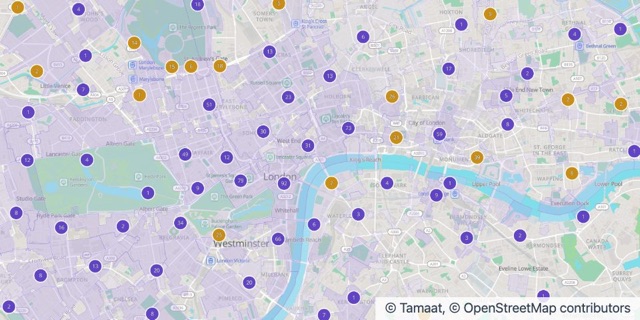 Map + ChartsHeritage LondonInner London’s 1,500 Grade I and II* buildings over its 535 conservation areas. Know what is protected before you design, buy or build.Culture, Heritage and TourismHistoric England
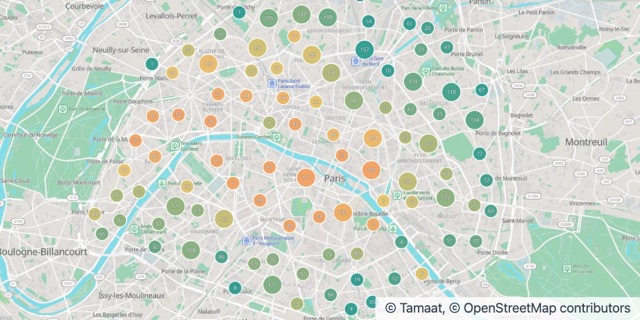 Map + ChartsParis home pricesEvery apartment sale in Paris at the end of 2025, priced per square metre. The Left Bank premium, sale by sale.Real Estate and PropertyDGFiP
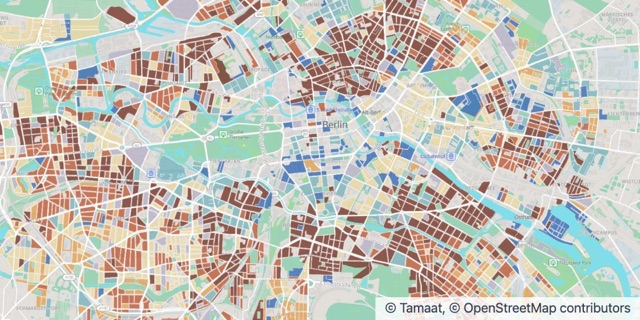 Map + ChartsBerlin building ageWhen the homes inside the S-Bahn ring were built, block by block. The city’s history in brick, from the Gründerzeit to today.Real Estate and PropertySenatsverwaltung Berlin
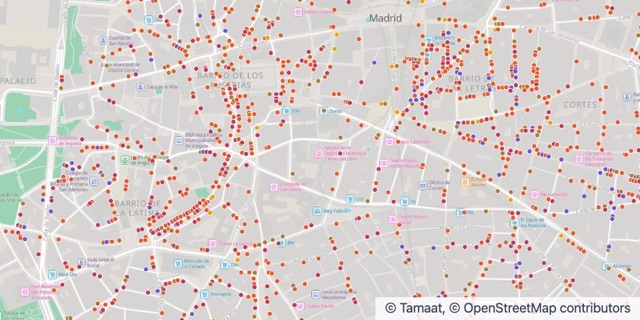 Map + ChartsWhere central Madrid eats and drinksEvery restaurant, tapas bar, café and late-night bar in the centre of Madrid. Find the streets that never stop serving.Retail and HospitalityAyuntamiento de Madrid
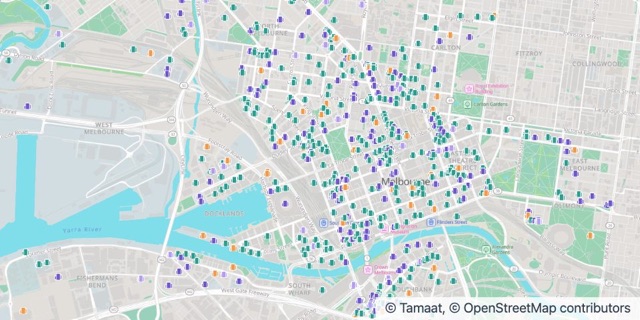 Map + ChartsWhat’s being built in MelbourneEvery major development in the City of Melbourne since 2016, and 38,000 new homes in the pipeline. See where the city is growing up.Real Estate and PropertyCity of Melbourne
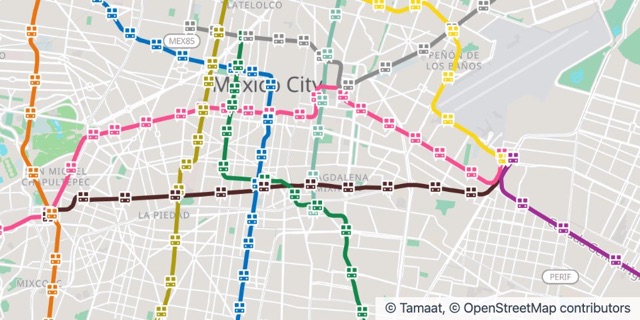 Map + ChartsMexico City MetroAll twelve Metro lines and 195 stations in their official colours. The backbone of a city of nine million.Transportation and LogisticsSEMOVI, Gobierno de la Ciudad de México
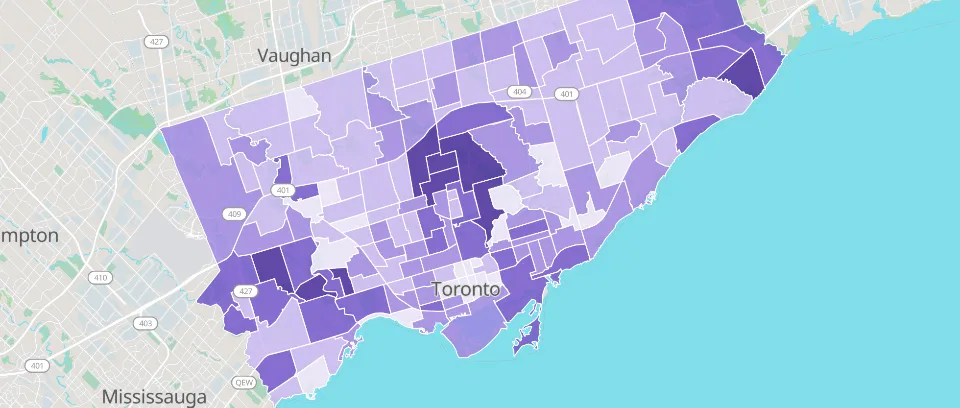 MapToronto household incomeMedian household income in all 158 neighbourhoods. Size up a market before you choose a site.Cities and Public SectorCity of Toronto
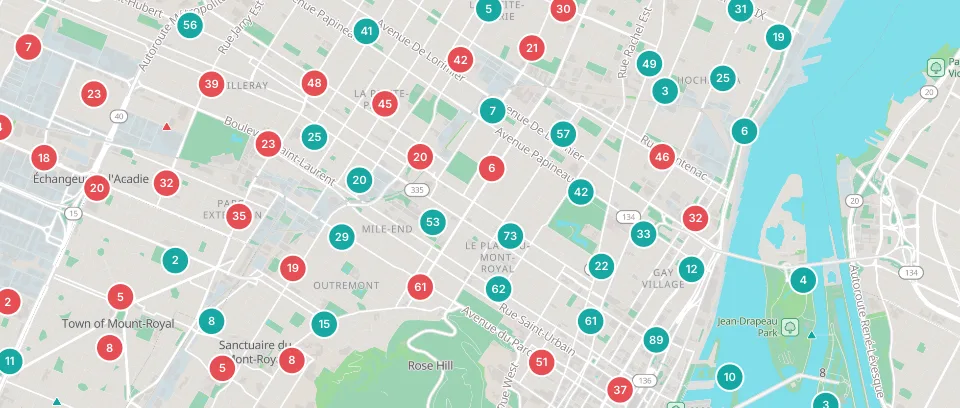 MapMontréal road safety4,700 collisions that injured people walking, cycling or riding a motorcycle. Find the corridors that need safer streets.Cities and Public SectorVille de Montréal
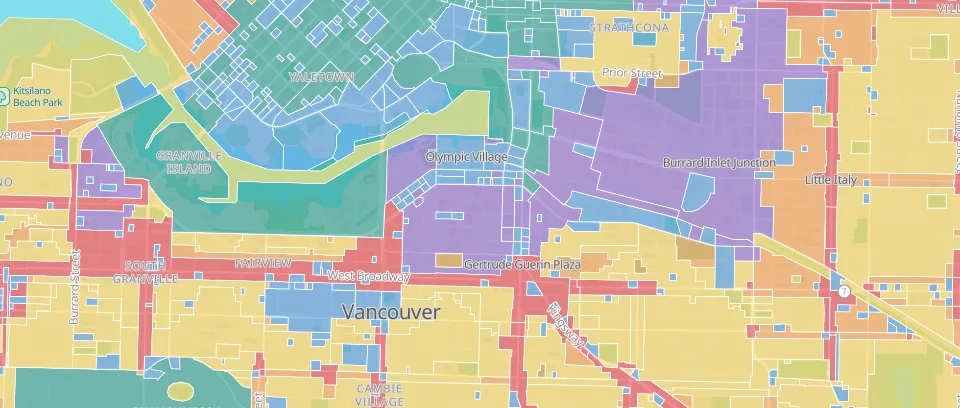 MapVancouver zoningEvery zoning district in six land uses. See what can be built where, block by block.Real Estate and PropertyCity of Vancouver