Los Angeles urban heat
Afternoon air temperature by census block group, compared with the area average. Source: NOAA and CAPA Strategies, Urban Heat Island Mapping Campaign (heat.gov), CC0; U.S. Census Bureau.
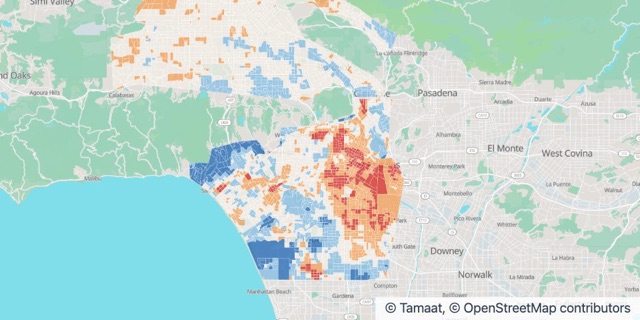
Afternoon heat vs area average
- 3 °F or more cooler
- 1 – 3 °F cooler
- Near average
- 1 – 3 °F hotter
- 3 °F or more hotter
Where the Data Comes From
- Publisher
- NOAA and CAPA Strategies
- Dataset
- Urban Heat Island Mapping Campaign
- Licence
- CC0 1.0
- Publisher
- U.S. Census Bureau
- Dataset
- Place names
- Licence
- Public domain
- Credit
- Source: NOAA and CAPA Strategies, Urban Heat Island Mapping Campaign (heat.gov), CC0; U.S. Census Bureau.
Built from the publisher’s official data, tidied up so it reads clearly and loads fast. Nothing is made up and nothing is moved.
What’s Inside
- 1 layer: Afternoon heat vs area average
- 2 live charts beside the map
- Already styled and ready to share
- It opens as your own copy. Swap in your data whenever you like.