The phone draws each layer exactly as it is styled on the web: categories and ranges, icons, line and fill styles, and labels. There is nothing to set up on the phone.
What the colours mean
Tap the legend button at the bottom left. Each layer on the map is listed by name with its symbols, what each one means, and how many records each holds. Tap the button again, or ✕, to put it away.
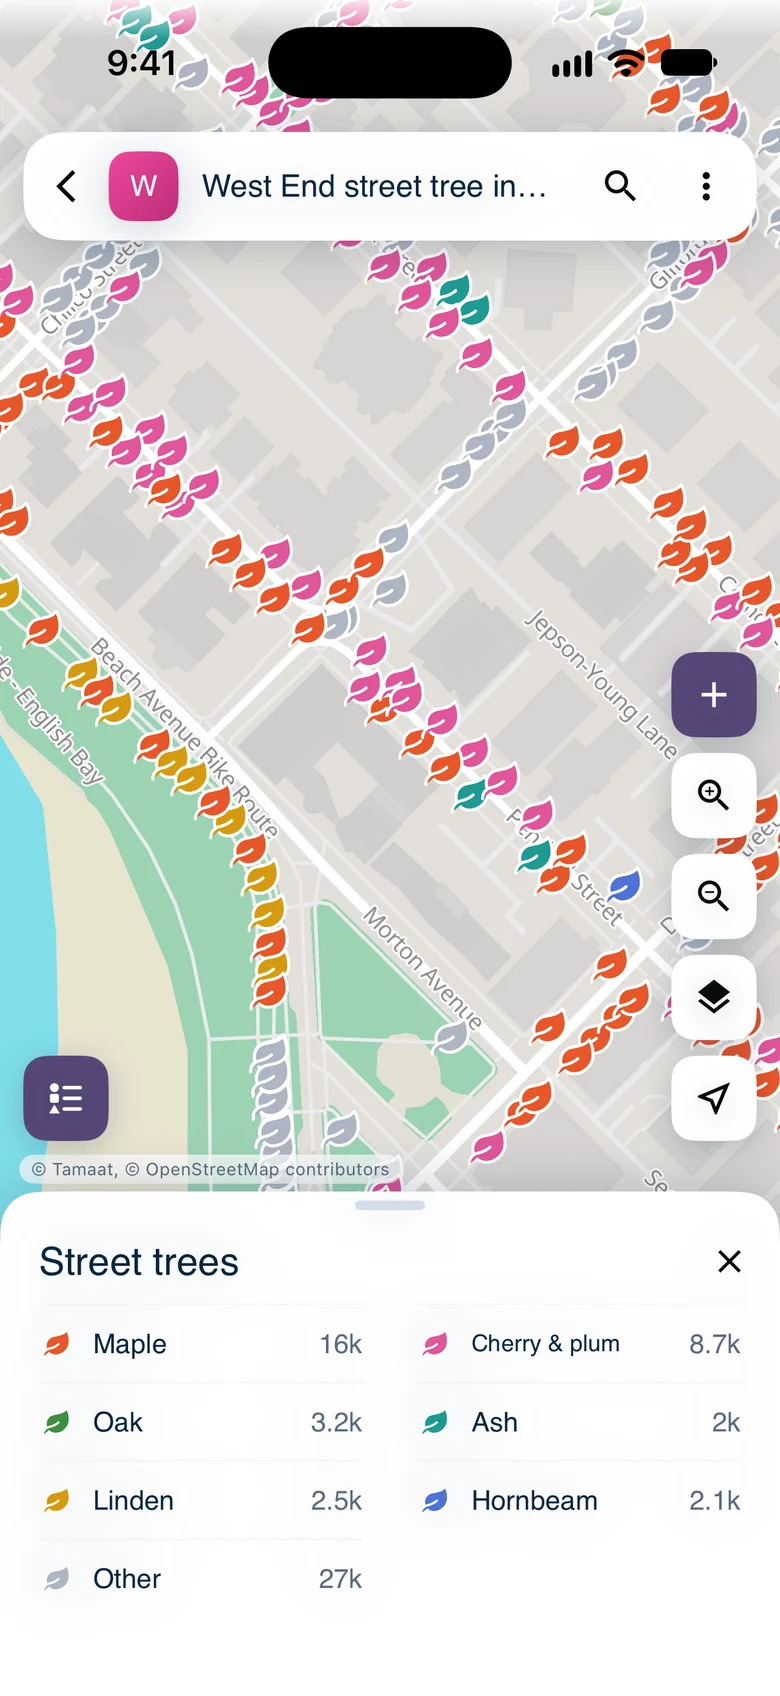 The legend for street trees: Maple 16k, Cherry & plum 8.7k and the other species groups, each with its leaf
Clusters
Zoom out on a layer with many points and nearby records gather into clusters. The number is how many records the cluster holds. The ring around it shows the mix, in the same colours as the legend.
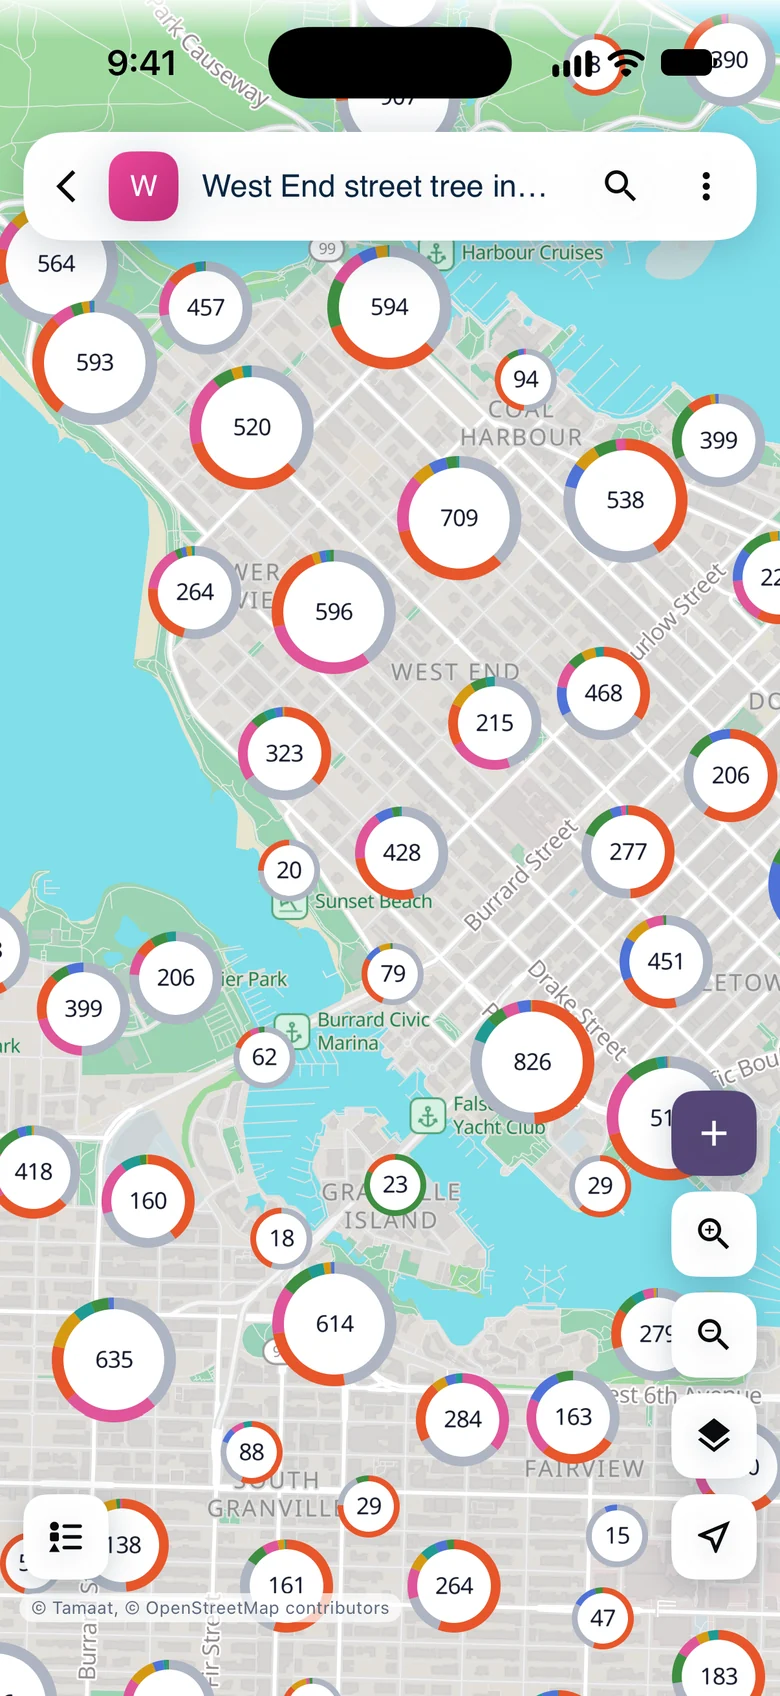 Street-tree clusters over downtown Vancouver, each ring showing the species mix
Tap a cluster to zoom in to it. Clusters break apart into single records at street level. At the closest cluster level, a tap lists the records it holds.
Lines and labels
Lines and areas keep their web styling too, with labels along them.
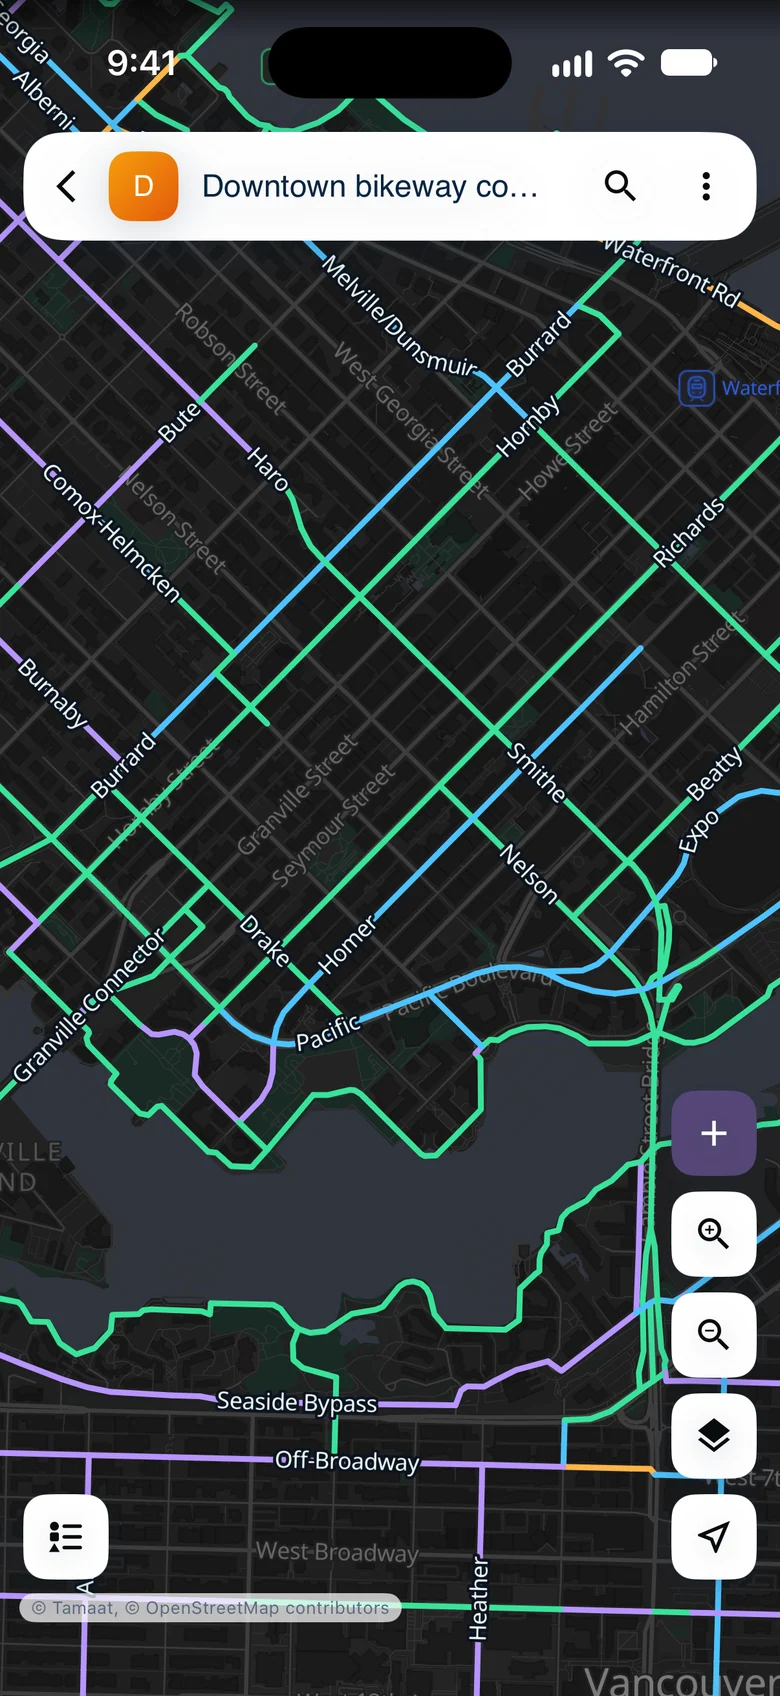 Vancouver's bikeway network on the dark basemap, coloured by lane type with route names
Show and hide layers
Tap "Layers" to see the project's layers. Tap the eye beside a layer to hide it or show it again. The number on the right is how many records the layer holds, and tapping a layer's name lists them.
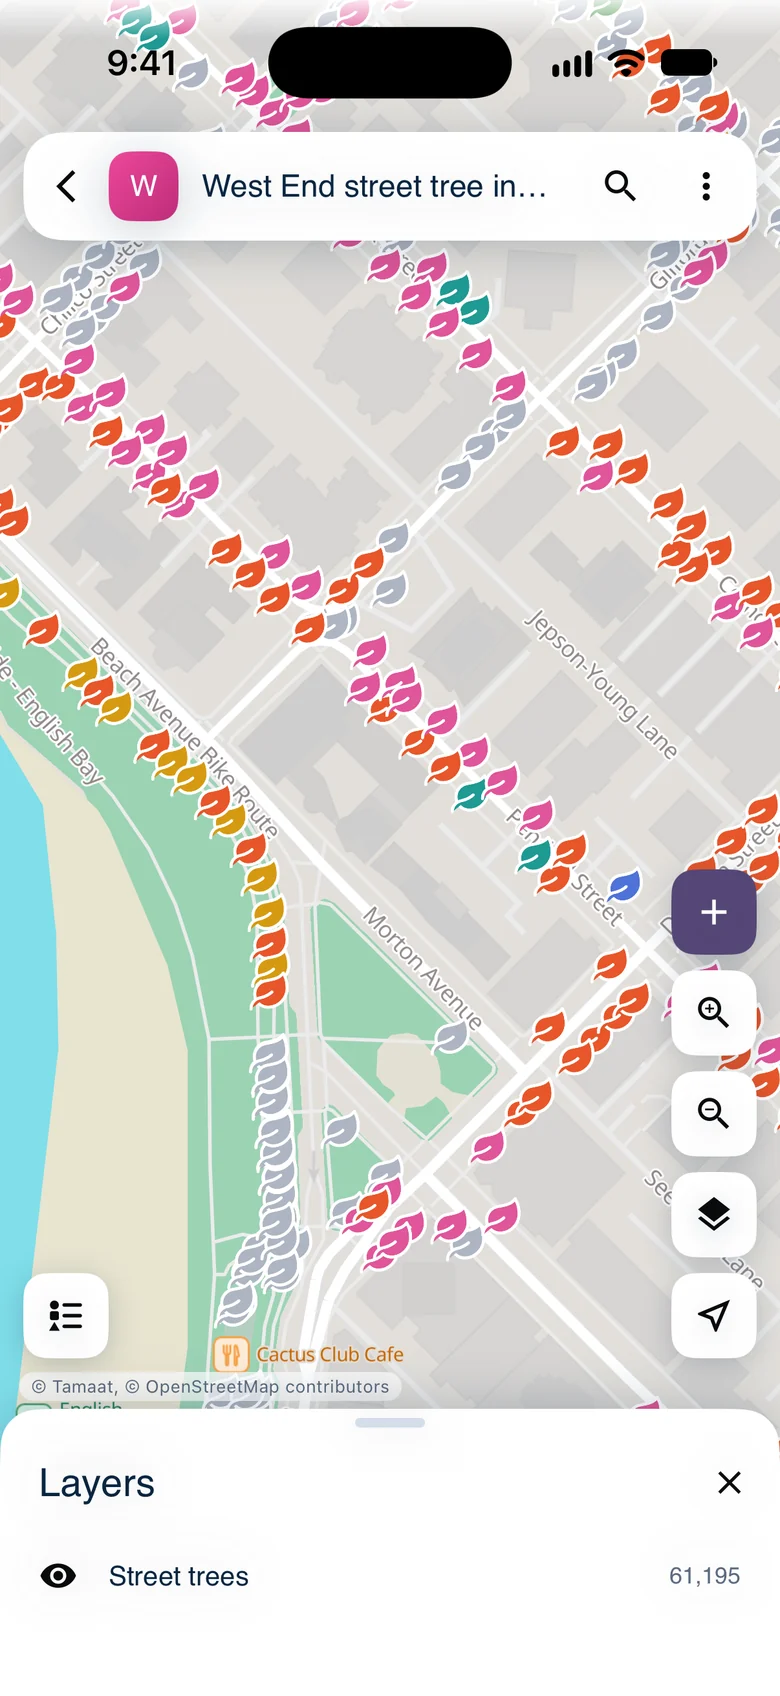 The Layers panel
Change the basemap
Tap ⋮, then "Basemap", and choose "Default", "Light", "Gray", "Dark" or "Black". This changes the map on your phone only. "Use project default" goes back to the project's own choice.
Find your way
Tap "My location" to centre the map on where you are. Touch and hold it to turn location off. "Show whole layer" in ⋮ fits the map to a layer.
Demo data: City of Vancouver Open Data — street trees and bikeways.
- Find a Record
- Prepare a Map for the Field — how the web style drives all of this